C2C crochet graph maker
A corner-to-corner graph, and every row written out.
Drop files here
or click to choose from your deviceAccepted: JPG, JPEG, PNG, WEBP, AVIF, GIF, BMP, HEIC, HEIF
One file per runUp to 20 MB per file5 runs per dayFree PDFs end with a small “Made with nouplo.com” lineRemove limits with Pro✓ Works offline
Your files stay on your device
This tool runs entirely in your browser. Nothing is uploaded, nothing is stored, and you can even turn off your internet connection before you start.
Example
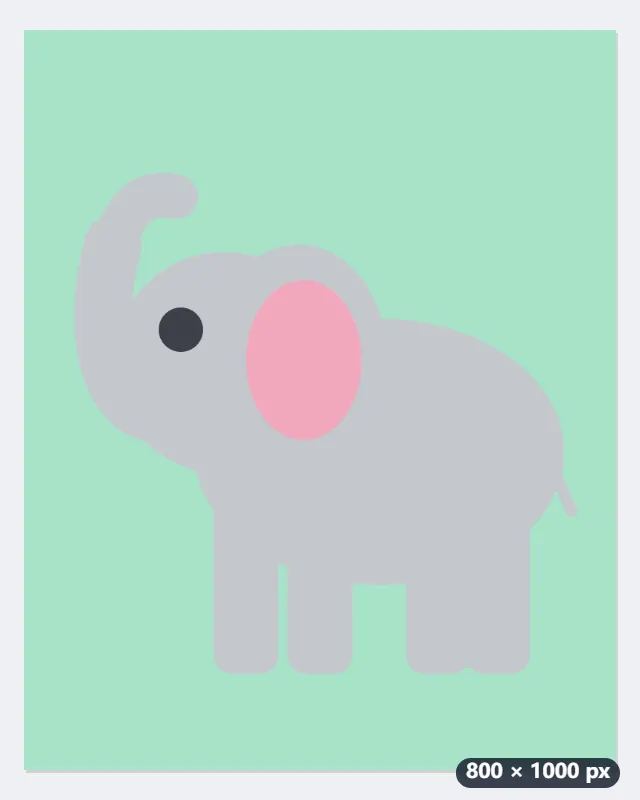
Example: a 40 × 50 elephant baby blanket in C2C, written out in 89 rows
An 800 × 1000 pixel picture of a light grey elephant with a pink ear and a dark eye on mint green, for a baby blanket. Chart for “C2C crochet”, 40 tiles across, at most 4 yarn colours, US Letter. The height follows the picture: 40 × 1000 ÷ 800 = 50 tiles.
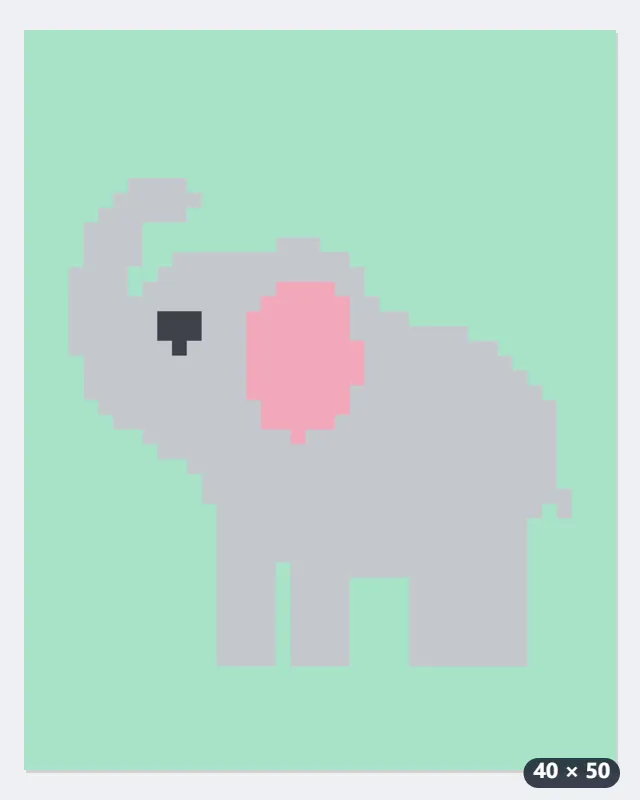
- 40 × 50 tiles make 89 diagonal rows (40 + 50 − 1) and 2,000 tiles to crochet.
- Row 1 is the single tile in the bottom right corner. Odd rows go up and to the right, even rows down and to the left; each row lists its colour runs in working order.
- Rows 1–40: increase at both ends. Rows 41–50: “the bottom edge is complete — decrease at the left end, keep increasing at the right end”. Rows 51–89: decrease at both ends.
- Every row has a tick box; row 89 is the last tile, in the top left corner.
| Rows | Tiles per row | What to do |
|---|---|---|
| 1–40 | 1 to 40, one more each row | Increase at both ends |
| 41–50 | 40 each | Decrease at the left end, increase at the right |
| 51–89 | 39 down to 1 | Decrease at both ends |
A PDF with the preview, the yarn key, the graph and the written rows, plus the preview as a PNG. If a test tile in your yarn measures 1 inch, the blanket comes out 40 × 50 inches; at 1¼ inches a tile, 50 × 62½.
How it works
- Add a picture and choose the width in tiles and the number of yarn colours.
- Press Make graph: the PDF has the graph and the written rows, each with its colour counts.
- Work from row 1 in the bottom-right corner, ticking each row off as you go.
Frequently asked questions
- What do the written rows say?
- Each diagonal row in the order you work it, as colour runs — “Row 12 ↗ 3 A, 5 B, 4 A (12)” — with the increase and decrease sections marked.
- Does it work for rectangles?
- Yes: the instructions say where one edge is complete and you keep increasing at one end while decreasing at the other.
- How big will the blanket be?
- One tile for each square of the graph, so crochet a few tiles in your yarn, measure one and multiply. At 1 inch a tile, a 40 × 50 graph is a 40 × 50 in blanket.
- How many rows will my graph have?
- Tiles across plus tiles down, minus one: 40 × 50 gives 89 diagonal rows. The tiles down follow your picture’s shape, so a square picture at 40 across gives 40 × 40 tiles and 79 rows.
- How many yarn colours should I choose?
- As few as the picture allows, since every colour is another bobbin to manage along a row. The page starts at 4; you can go from 2 to 12, and “Remove lone stitches” keeps single tiles of a colour from scattering across the graph.
- Is my picture uploaded?
- No. The chart is made in your browser; the picture never leaves your device.